
| Color | Frequency balance | Texture |
|---|---|---|
| White | Roughly equal power across frequencies | Bright hiss |
| Pink | Less power at higher frequencies | Softer balance |
| Brown | Stronger emphasis on low frequencies | Deep rumble; limited bass on small speakers |
What changes between colors
The controls above use a single noise layer. Selecting another color replaces the noise color while keeping the main volume unchanged. Each sample is a 20-second synthetic loop with no voices or music.
Digital levels are matched, but perceived loudness still depends on frequency balance, your hearing and the speaker. Compare gently; do not keep raising the level to make a phone reproduce low bass.
How to make a useful comparison
- Choose a low device output and a short timer.
- Press Play on one color, then switch to hear the difference. Paused selection changes stay silent.
- Listen for brightness, low rumble and whether the texture is distracting. There is no requirement to prefer one.
- Pause when done. A sound you dislike is a reason to stop, not to add more layers.
No color wins for every baby
Descriptions such as “softer” or “deeper” refer to the sound, not infant sleep quality. The site has no evidence that brown noise treats attention conditions or that pink noise is the best baby-sleep choice.
A 2026 adult laboratory study found reduced REM sleep with pink noise under its tested conditions. It does not establish the effects of these samples on babies. Evidence and safety questions need more than a color name.
Measured here
What is in the files?
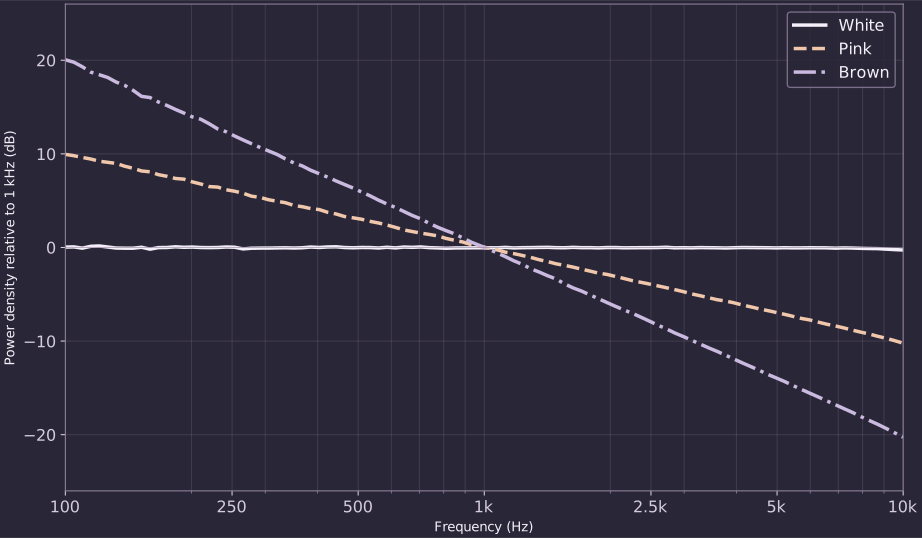
These curves come from the three audio loops in this player. Each curve is set to 0 dB at 1 kHz so you can compare its shape. This is a frequency comparison, not a loudness ranking.

| Noise | dB per octave | Loop |
|---|---|---|
| White | -0.01 | 20 s |
| Pink | -3.02 | 20 s |
| Brown | -6.04 | 20 s |
How we measured this
We analyzed the delivered mono WAV files at 48 kHz with a Welch power-spectrum estimate: 16,384-sample Hann windows with a hop of 8,192 samples. Each point averages linear power density in a 1/12-octave band. The slope is a line fitted against log₂ frequency between 100 Hz and 10 kHz. These finite loops vary slightly from ideal mathematical spectra.
Sources and limits
These sources support the factual explanations. They do not endorse this site or certify a particular playback setup.
Sources checked October 10, 2026. Written for this project; no clinical review is claimed.